Poverty Research
Calcutta Rescue’s Chief Executive, Jaydeep Chakraborty, has been a fan of economists Abhijit Banerjee and Esther Duflo’s work for years. Their 2019 Nobel Prize for Economics demonstrated the vital importance of evidence-driven research in understanding the real needs of communities, rather than relying on assumptions and superficial appearances.
In 2019, Calcutta Rescue carried out a major ground-breaking survey of poverty in 22 slums where we work, led by volunteer researcher Maurice Lange.
The data gathered from the survey, now published in the Journal of Poverty and Social Justice, will help to inform decisions about allocating Calcutta Rescue’s resources.
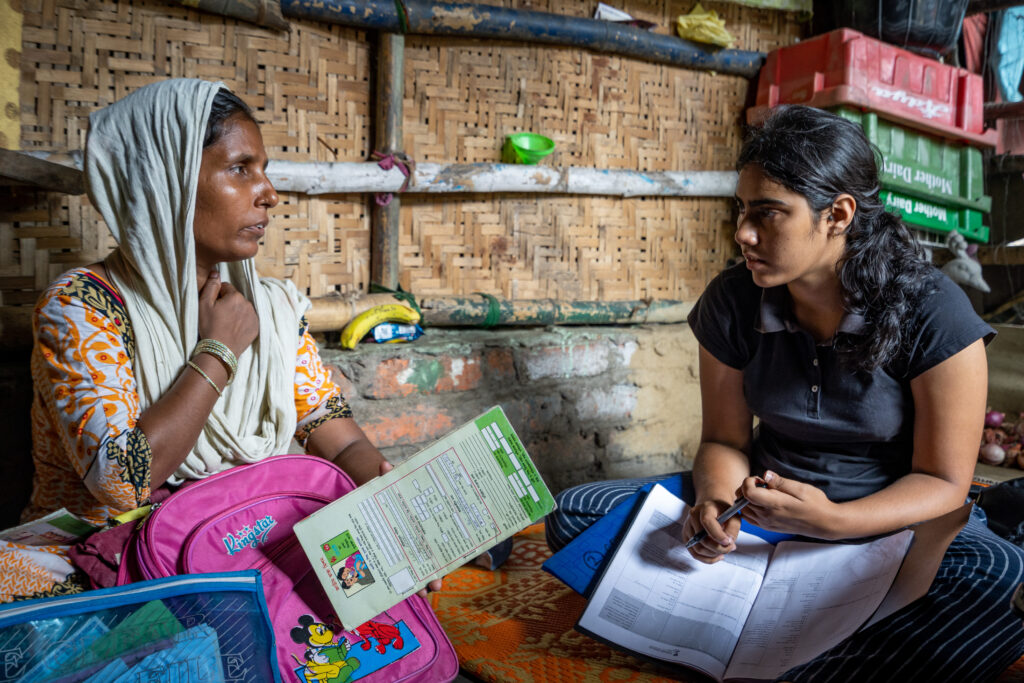
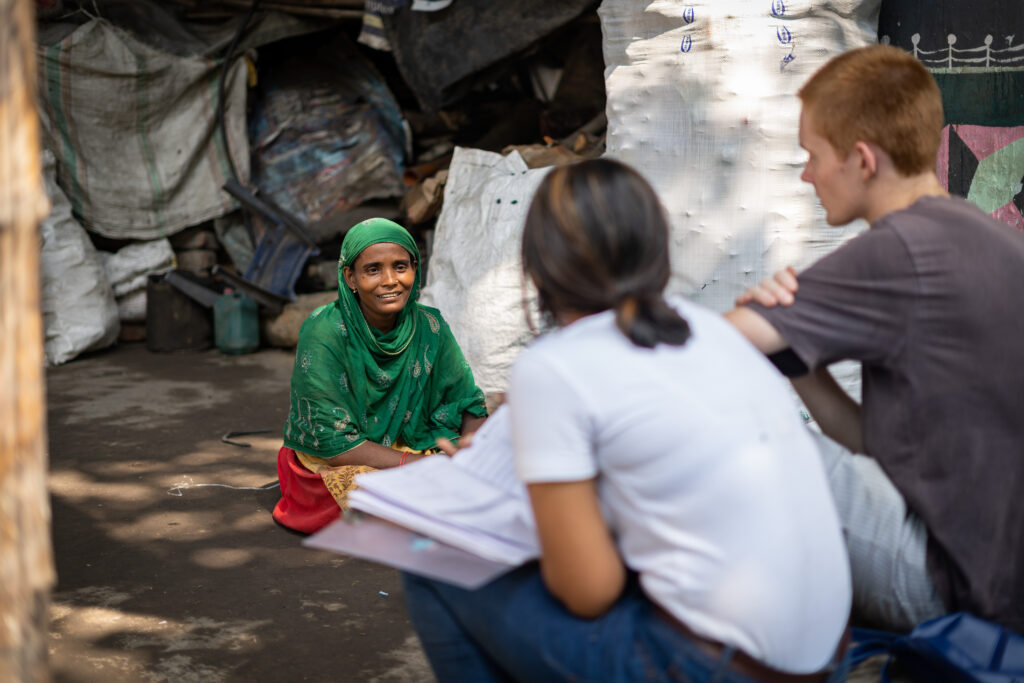
The survey took six months and involved almost 1,000 interviews.
The results will enable Calcutta Rescue to understand the issues driving poverty in each community and make decisions about how best to assist them which are rooted in hard data.
See below for a detailed summary of results, written by Maurice Lange:
Calcutta Rescue’s Multidimensional Poverty Survey
We are pleased to present the results of Calcutta Rescue’s first large-scale study of the poverty experienced by CR’s service users. It is the largest and most detailed research of its kind conducted in Kolkata in the last two decades.
The primary aim of the study was to generate information that would enable CR to rank different slum areas relative to each other in terms of overall, multidimensional impoverishment, and levels of deprivation in specific indicators. This ranking will help CR’s management to prioritize resources, and target interventions according to need. The study’s secondary objective was to provide CR with a template methodology that can be repeated and used to capture improvement over time or after specific interventions.
The survey was developed by Eleo Tibbs and Maurice Lange, two researchers from the UK. They adapted the UN’s Multidimensional Poverty Index for use in the local context and for CR’s purposes and worked with guidance from Suman Seth and Indranil Dutta of The University of Leeds and The University of Manchester, respectively. They recruited a group of 16 volunteer data collectors, trained them, and interviewed a 664 of households across 16 different slums in the city. Maurice left Kolkata in September 2019, but has continued to work on analysis, and guide further research from the UK. Jasmijn Loos and Ezra Spinner, from the Netherlands, followed the same methodology to survey a further 203 households across seven slum areas in November and December 2020.
Overall poverty
The study found a considerable degree of variation in the levels of poverty in each slum area: As poverty is defined by our method, the poorest slum area was five times poorer than the least poor slum area.
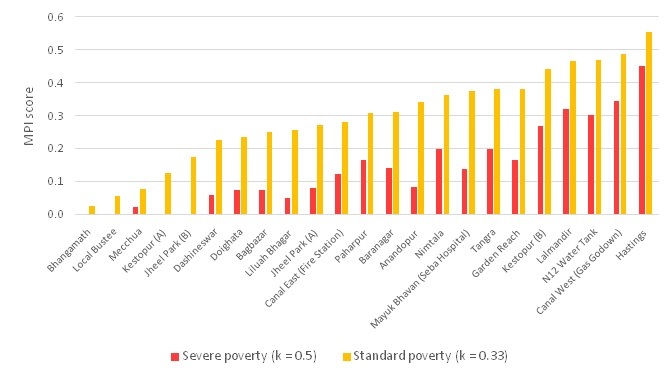
Figure 1: MPI scores for all slum areas using standard and severe poverty thresholds.
The poorest slum areaswere Hastings, Canal West Gas Godown, Number 12 Water Tank and Lalmandir. The least poor slums surveyed were Mecchua, Bhangamath, Local Bustee.
For ‘severe’ poverty, the difference between the poorest and the least poor slums was even greater; while no households at Bhangamath, Local Bustee, Kestopur A or Jheel Park B met the threshold for severe poverty, 71% of households at Hastings and 56% at Canal West Gas Godown were deemed severely poor.
On average, Muslim households were found to be 50% poorer than Hindu households.
Individual indicators
Analysis of deprivation indicator by indicator revealed further variation across the slum areas. Slum area soften performed well in one indicator and very poorly in another, underlining the importance of studying the data in detail. The breakdown by indicator and slum area below provides CR with a snapshot of the relative deprivations in each area and will be used as a tool to guide efforts to alleviate problems specific to each slum area.
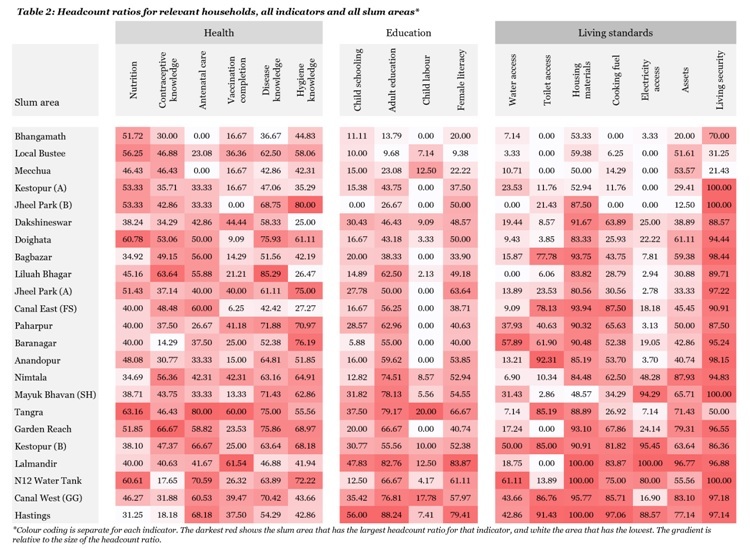
Health
While there was generally a lower degree of variation between health indicators across slum areas, specific sub-indicators did identify some key areas of interest:
Vaccinations: One quarter of households with young children were behind on their vaccinations. This was particularly evident in Nimtala (42%), Tangra (60%) and Lalmandir (62%).
Obesity: We found surprisingly high levels of obesity. We mostly measured women aged between 18 and 45 years old. We found that 30% of all respondents were obese (according to the South-Asian adjusted BMI threshold – 25). Local Bustee (47%), Jheel Park A (47%) and Bhangamath (48%) had the highest obesity rates.
Antenatal care: 56% of all women who had had a child in the last 5 years had not seen a medical professional within the first 3 months of their pregnancy; this figure is over 75% at the most deprived slum areas. Using this information, we can infer that at least half of mothers fail to meet the old WHO guidelines of 4 meetings with a medical professional prior to birth, and most would fail to make the now recommended 8.
Health knowledge: Deprivation in knowledge of modern contraception (43%), of endemic diseases (65%) and of hygiene practices (51%) was generally very high.
Education & child labour
Levels of education in each slum area varied considerably, allowing us to point out areas of priority.
Hastings (56%), Lalmandir (48%), Canal West Gas Godown (35%) and Mayuk Bhavan (35%) experience highest levels of deprivation for children’s education (at least one child between the age of 4 and 16 not attending school). These areas also performed most poorly for adult education (88%, 83%, 77% and 76% respectively).
Child labour is rare in most slum areas, and non-attendance of school is far more prevalent in all areas. Tangra (20%) and Canal West Gas Godown (18%) reported the highest proportion of households in whom a child under the age of 14 engaged in paid work.
Standard of living
In all of the standard of living indicators there is considerable variation between slum areas, though for some indicators (e.g. water access and electricity access) only a few slums are majority deprived, while for other indicators most households in most slum areas are deprived (e.g. housing materials and living security).
Water access: Access is generally good – 4/5 households reported being able to get water within 30 minutes from a source available for over 2 hours per day. However, several slums including Number 12 Water Tank (62%), Bharanagar (52%), Kestopur B (50%), and Canal West Gas Godown (44%) had significant deprivation in water access.
Sanitation: Slum areas tended to either be mostly deprived or mostly non-deprived for this indicator. Canal West Gas Godown, Canal East Fire Station, Kestopur B, Hastings, Anandopur and Bagbazar all see almost all households not using even ‘limited’ sanitation facilities.
Cooking fuels: 50% of households reported cooking with wood the majority of the time. In Canal West Gas Godown, Canal East Fire Station, Hastings, Garden Reach and Kestopur B, over 80% of households reported using wood the majority of the time.
Electricity: 70% of households reportedly had access to reasonable quality electricity, albeit obtained illegally in most cases. Some slums did have almost no electricity access however: Number 12 Water Tank (80%), Mayuk Bhavan (94%), Kestopur B (95%) and Hastings (89%).
Living security: Nearly all households in all slum areas fear eviction, which is unsurprising given the precarity of their legal status and physical locations. Far lower rates of fear of eviction are seen at Local Bustee (31%) and Mecchua (21%)– both are registered slum areas in which the majority of households (88% and 93%, respectively) rent their homes.
Summary
This detailed report provides CR with a snapshot of the factors which contribute most to poverty across 23 slum areas. All the information has been written up in a large internal report, and the key findings are due for publication in the Journal of Poverty and Social Justice.
CR has already begun work on projects to improve knowledge of contraception and prevalent diseases. The MPI scores have also informed tentative changes to the regularity of visits to some of the less poor areas, allowing greater focus on the poorest. CR has presented its findings to the Department of Urban Housing for West Bengal, and, where it can’t act to improve conditions itself, hopes this partnership, and those built with other NGOs will help transform this project from information into action.
Maurice Lange June 2020
Calcutta Rescue is committed to continuing to build evidence by researching the needs of the slum communities we serve. A collaborative of researchers has been formed to seek further opportunities to build knowledge and inform Calcutta Rescue’s decision making for the future.